Flood Frequency Mapping Service applied to Colombia
Service summary
The Flood Frequency Mapping (FFM) service exploits multitemporal flood extent mapping to generate a flood frequency map that illustrates flood occurrence patterns. The service relies on flood maps derived from both optical and SAR data that are systematically analysed over the entire Sentinel-2 (L2A) and Sentinel-1 (GRD) archive from 2015 to 2024, with regular updates. The service operates independently of user triggers, generating updated flood extent maps using Sentinel-1 and Sentinel-2 data and an automated change detection algorithm. Over time, the full stack of these flood extent maps is analysed to produce the comprehensive flood frequency map that shows the recurrence of flooding across the AOI, that for the pre-operational implementation of the service is the Mojana region (Colombia).
The pre-operational implementation of the FFM service has an initial execution to compute the flood frequency of the full 2015-2024 archive. Afterwards, the flood frequency map is updated every six months, incorporating all new Sentinel-1 and Sentinel-2 acquisitions in the analysis.
The service has been developed by CIMA Research Foundation and WASDI Sarl and is available through the CopernicusLAC Specialized Processing Environment (PE), powered by WASDI Sarl.
To read more about the pre-operational implementation in Colombia, please take a look at this presentation
The Flood Frequency Mapping Workspaces
The Flood Frequency Mapping (FFM) service has been implemented for the user-defined Areas of Interest (AOIs) within the Mojana region in Colombia.
This service is delivered through dedicated workspaces on the CopernicusLAC Specialized Processing Environment (PE). Each workspace collects the flood extent maps and the flood frequency maps generated for the selected AOI.
The FFM service is designed for continuous monitoring. It processes all available satellite imagery over the AOI, generates corresponding flood maps, and updates the flood frequency map every six months based on the new data.
Due to the large volume of data, and in agreement with the users’ requirements, the service outputs are organized across two separate workspaces:
- Archive workspaceName: COPLAC_UC2_archivoContains the complete archive of all flood extent maps and the full flood frequency map for the AOI.
- Operational workspaceName: COPLAC_UC2_operacionalA streamlined version of the archive, containing only the most recent flood extent maps and the latest updated frequency map.
You can access the FFM workspaces in two ways:
Direct Links:
Archive workspace link: WASDI 2.0 - COPLAC_UC2_archivo
Operational workspace link: WASDI 2.0 - COPLAC_UC2_operacional
- From the workspaces manager section:Both COPLAC_UC2_archivo and COPLAC_UC2_operacional are visible in your workspaces list, as shown in Figure 9) if you are correctly registered as a CopernicusLAC user (check the Access the platform section).
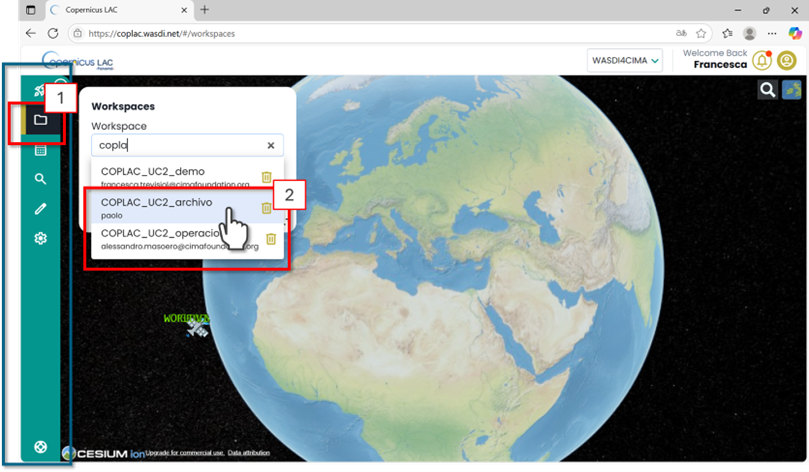
Figure 9. CopernicusLAC Flood Frequency Mapping Service – Accessing from the CopernicusLAC Workspace Menu the dedicated COPLAC_UC2_archivo or COPLAC_UC2_operacional workspaces.
In the full archive workspace, the panel at the top left of the interface displays a list of all available layers (Figure 10). These include all processed data from 2015 to the present. The data are continually updated on the workspaces as soon as they have been processed.
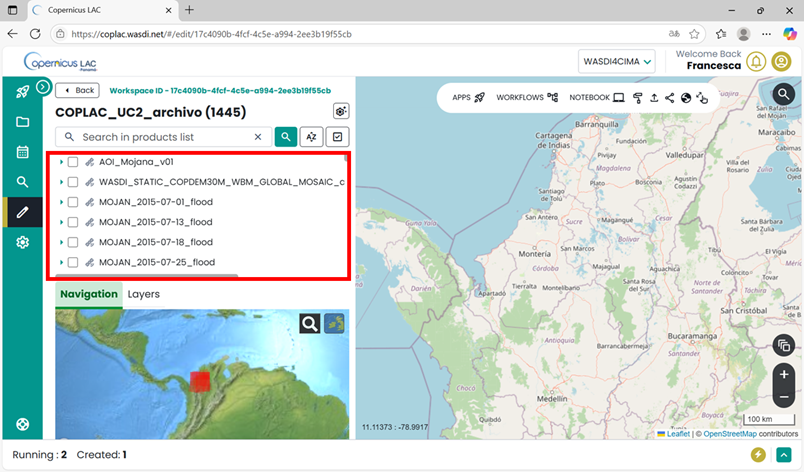
Figure 10. CopernicusLAC – Flood Frequency Mapping Service Workspace
Output, data visualization and download
The service will produce as output the following GeoTIFF: The workspace contains a collection of flood extent maps generated from Sentinel-1 (SAR) and Sentinel-2 (optical) satellite imagery acquired between 2015 and the present. These datasets provide both single-date flood extent products and cumulative summaries over 16-day intervals. The available files include the following GeoTIFF:
MOJAN_[DATE]_flood.tiffFlood extent map from Sentinel-1 SAR data acquired on [DATE] (Legend 1).MOJAN_[DATE]_s2-flood.tiffFlood extent map from Sentinel-2 optical data acquired on [DATE] (Legend 1).MOJAN_[StartDate]_[EndDate]_sar_flood_sum_days_16.tifCumulative maximum extent computed from the available SAR-derived flood extent maps in the 16-day interval defined by StartDate and EndDate (Legend 1).MOJAN_[dateStart]_[dateEnd]_flood_sum_days_16.tifCumulative maximum extent computed from the available SAR and optical derived flood extent maps in the 16-day interval defined by dateStart and dateEnd (Legend 1).MOJAN_[StartDate]_[EndDate]_frisk[DAYS].tifComparative optical and SAR flood map (when boh S2 and S1 are available) (Legend 2).
Legend 1:
0 - No Data
1 - No Flood
2 - Permanent Water
3 - Flooded Areas
Legend 2:
0 - No Data
1 - No Flood
2 - One Map flood, the other one not flood
3 - One Map flood, the other one no data
4 - Both Maps flood
5 - Permanent Water
In addition, the workspace provides empirical flood frequency layers, updated every six months:
MOJANFFM_floodFlood count: number of times each pixel was classified as flooded, in the Sentinel-1 dervived maps.MOJANFFM_dataEO data count: number of times each pixel was observed in the Sentinel-1 dervived maps.MOJANFFM_frequencyEmpirical flood frequency based on Sentinel-1, computed as flood count / data count for each pixel.MOJANS2FFM_floodFlood count: number of times each pixel was classified as flooded, in the Sentinel-2 dervived maps.MOJANS2FFM_dataEO data count: number of times each pixel was observed in the Sentinel-2 dervived maps.MOJANS2FFM_frequencyEmpirical flood frequency based on Sentinel-2, computed as flood count / data count for each pixel.
You can either visualize the layers directly within the Specialized PE workspace or download them to your local device for further processing.
How to display data in your workspace in the Specialized PE?
Find your layer of interest in your workspace, expand the selection and toggle on the layer of interest and click on the lightbulb icon.
The selected layer will be displayed on the map, and the product should appear in the list of products in the Layer panel (Figure 11).
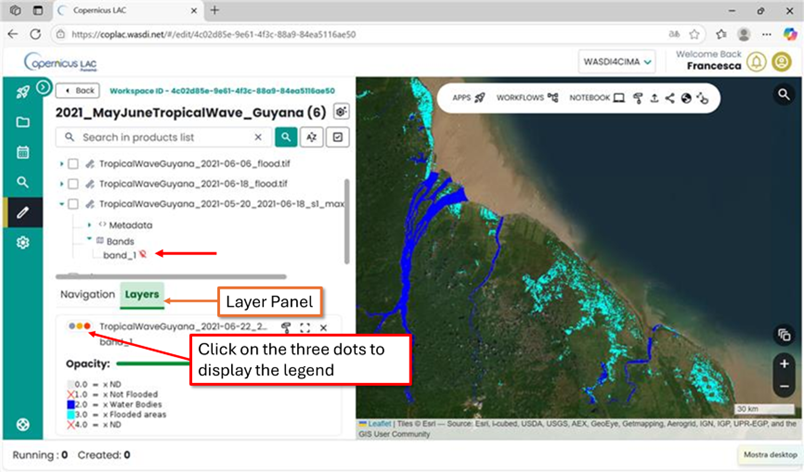
Figure 11. CopernicusLAC Specialized PE map visualization
How to download data from your workspace in the Specialized PE?
Access your CopernicusLAC Specialized PE workspace
Find your layer of interest in your workspace, and select it (Figure 12 - 1). The download option will appear on top the layer list (Figure 12 - 2).
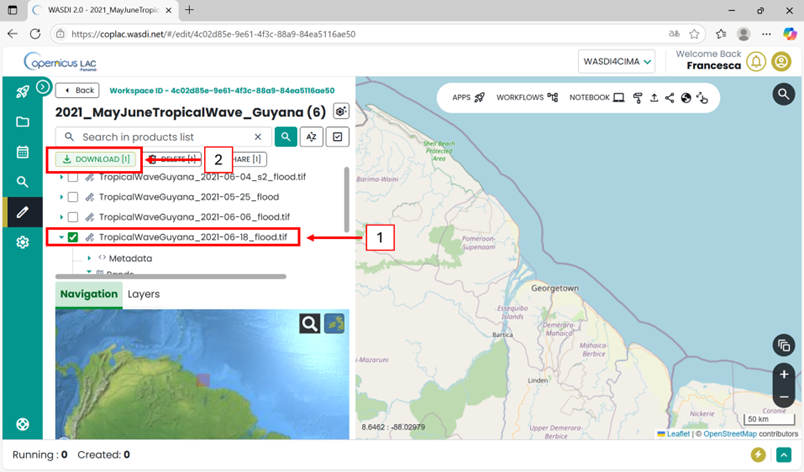
Figure 12. CopernicusLAC SpecializedPE data download
In the archive workspace, the layer on the top of the list is the initial Area of Interest defined by the users:
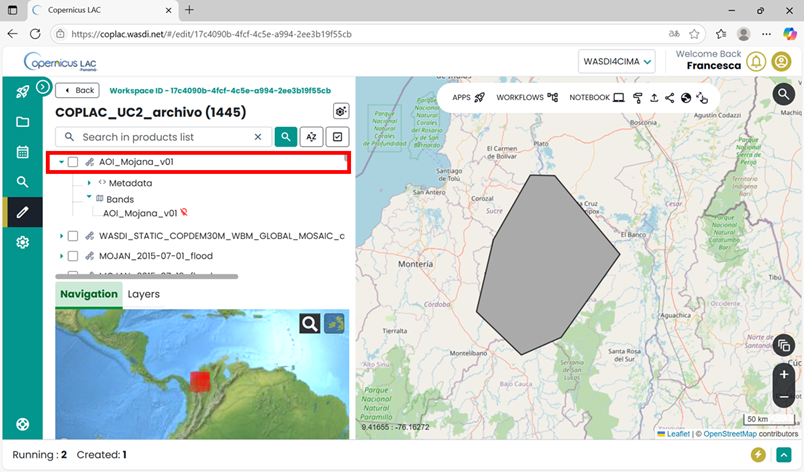
Figure 13. FFM Workspace – Area of interest
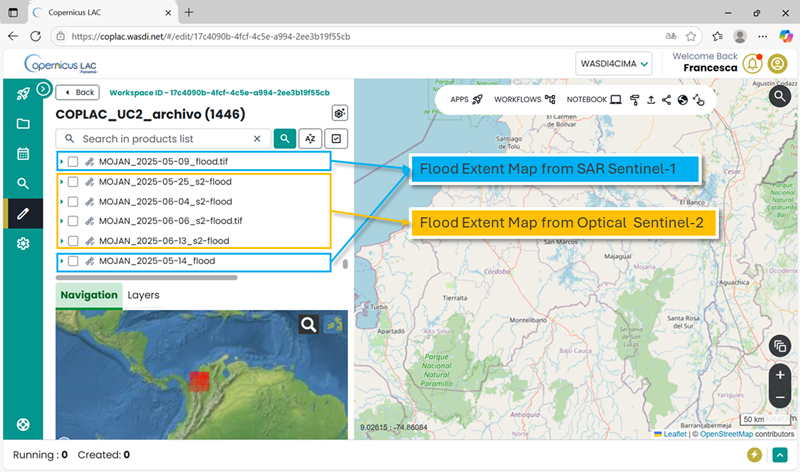
Figure 14. FFM Workspace – Flood Extent Maps
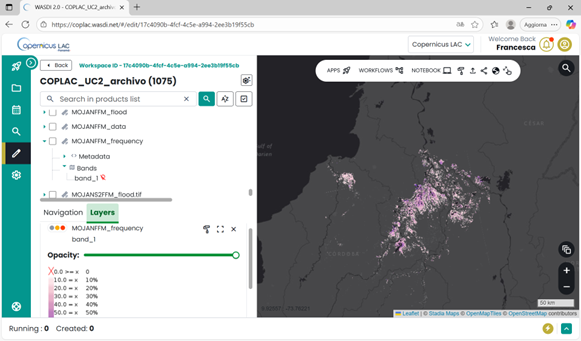
Figure 15. FFM Workspace – Flood Frequency Map