Flood Preparedness in the Caribbean
The pre-operational implementation of the services for flood preparedness in the Caribbean supports both the reconstruction of past flood events and the forecasting of analogous events.
The core idea is to use historical flood data, identified by the user within the target areas, to build a comprehensive set of possible flooded areas. This collection of reference events can then serve as analogous scenarios whenever a new flood event is expected to impact the region.
By linking each reconstructed event to clear triggers, the platform enables decision-makers to anticipate potential impacts more effectively, improve preparedness measures, and support timely response actions.
In this tutorial will be presented:
How to access the flood extent archive of past event for Country.
How to add trigger as metadata to flood extent maps, through the Flood Map Labeling.
How to retrieve flood extent maps of pas event that were generated by specific trigger trough the Map Fetching By Metadata.
To read more about the pre-operational implementation in the Caribbean, please take a look at this presentation
Past event reconstruction archives
For Belize, all the flood extent maps produced for past events have been organized across two workspaces:
- Archive workspaceName: FEM_archive_BELIZEWorkspace with all the flood extent maps produced for single dates.
- Operational workspaceName: FEM_archive_BELIZE_operationalWorkspace containing all flood extent maps produced for individual dates, some of which are already labeled.
You can access the archive workspaces in two ways:
Direct Links:
Archive workspace link: WASDI 2.0 - FEM_archive_BELIZE
Operational workspace link: WASDI 2.0 – FEM_archive_BELIZE_operational
- From the workspaces manager section:Both FEM_archive_BELIZE and FEM_archive_BELIZE_operational are visible in your workspaces list, as shown in Figure 1) if you are correctly registered as a CopernicusLAC user (check the Access the platform section).
If you encounter any issues accessing these workspaces, please contact business-team@wasdi.cloud and request access.
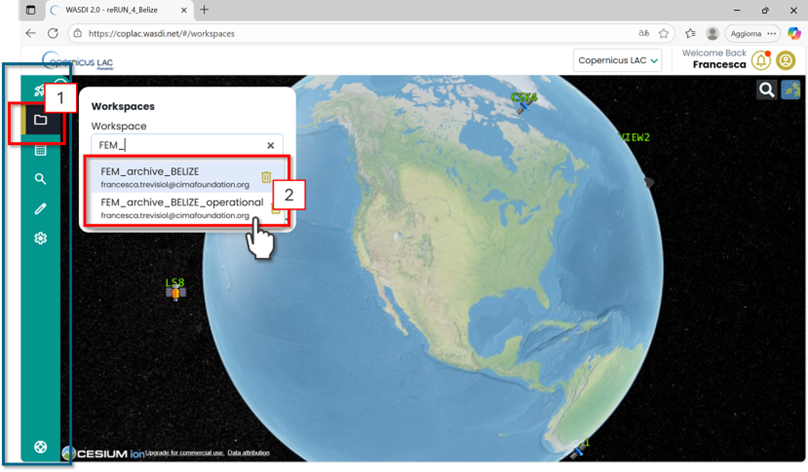
Figure 1. CopernicusLAC Flood Extent Mapping Archive – Accessing from the CopernicusLAC Workspace Menu the dedicated FEM_archive_BELIZE or FEM_archive_BELIZE_operacional workspaces.
In the full archive workspace, the panel at the top left of the interface displays a list of all available layers (Figure 2). These include all flood extent maps produced for selected past flood events.
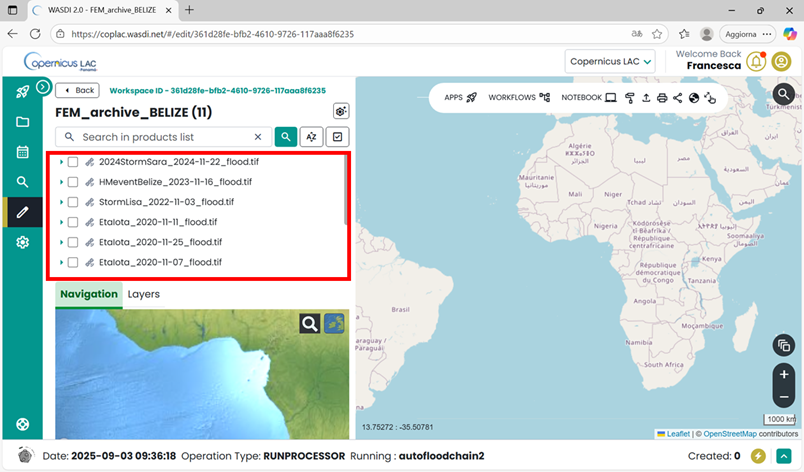
Figure 2. CopernicusLAC – Past event archive Workspace
Flood Map Labelling
To add trigger information to the existing flood extent maps as metadata, the Flood Map Labeling available in the marketplace can be used. Open the application.
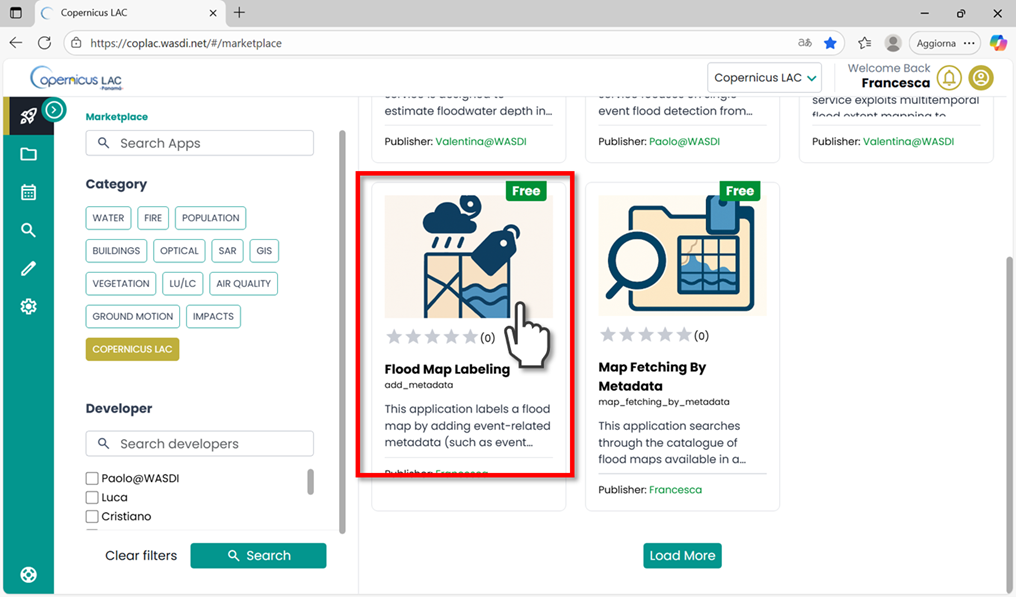
Figure 3. Flood Map Labeling in the CopernicusLAC Specialized PE Marketplace.
Every app has its Main Menu on the left side of the user interface. This is where you can access different tabs to configure parameters for running the app.
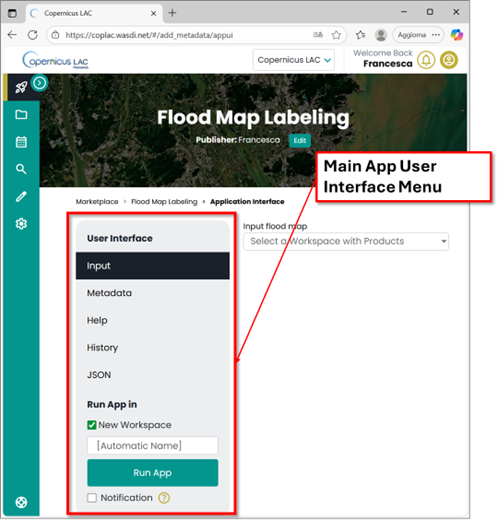
Figure 4. Flood Map Labeling user interface
The Flood Map Labeling app requires a flood extent map as input. This means you must run the app in the workspace where the flood extent map is stored.
To begin:
Scroll to the bottom of the Main Menu.
In the “Run App in” section, select the “Existing Workspace” option.
A dropdown menu will appear, allowing you to choose from your previously created workspaces.
Select the workspace that contains the flood extent map you want to add metadata to.
Note: If you haven’t already generated a flood extent map in your workspace, you can create one using the Flood Extent Mapping Service App: https://coplac.wasdi.net/#/cl_flood_extent/appDetails.
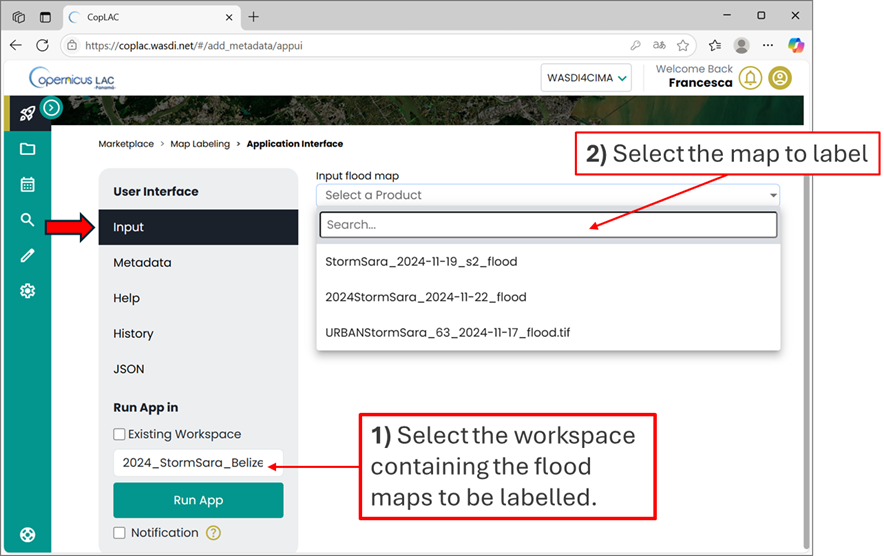
Figure 5. Flood Map Labeling user interface – Input
Click on the Metadata section, to fill the form with the values associated with the identified variables:
Select Weather Event Type: Hurricane, Storm or General HM event
Storm surge [m]
Wind speed [km/h]
Forecasted rainfall [mm]
Tidal surge [m]
Wind gust [m/s]
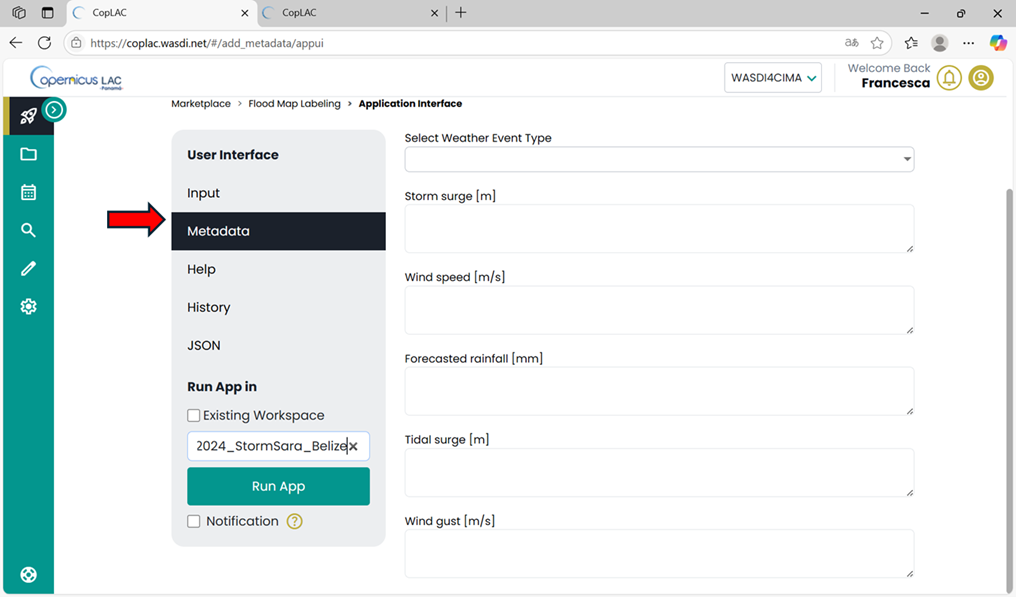
Figure 6. Flood Map Labeling user interface – Metadata
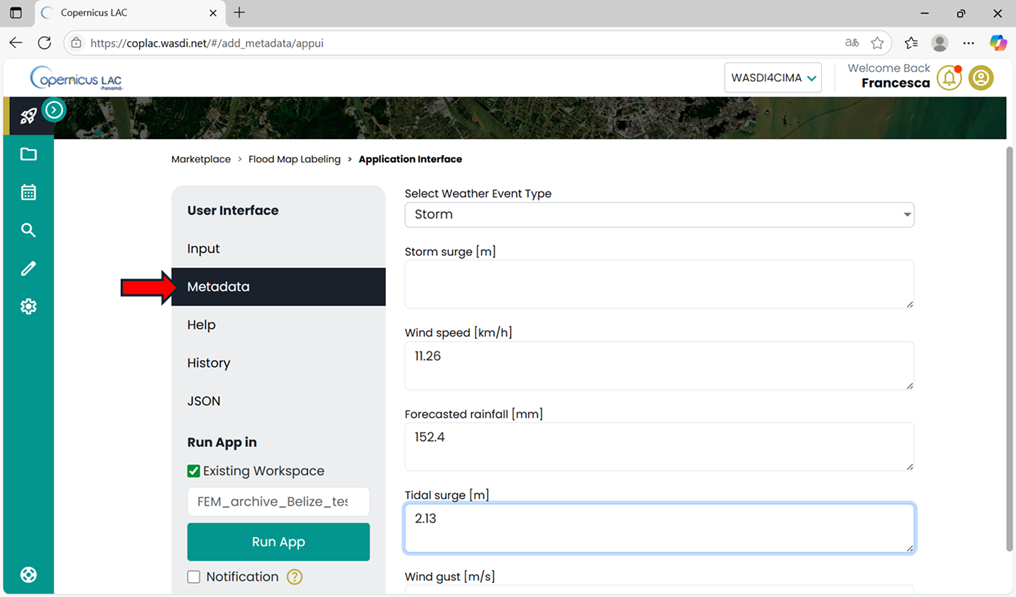
Figure 7. Flood Map Labeling user interface – Metadata example of trigger
Once all the available metadata fields are completed, start the processing by clicking the “Run App” button in the Main Menu. The platform will automatically redirect you to the selected workspace.
In the workspace, two new layers will appear:
[input_flood_map_name]_label: A flood extent map labeled with the provided variables. This file is intended for visualization.
[input_flood_map_name]_label_metadata: A flood extent map labeled with the provided variables. This file is designed to display the updated metadata directly on the platform.
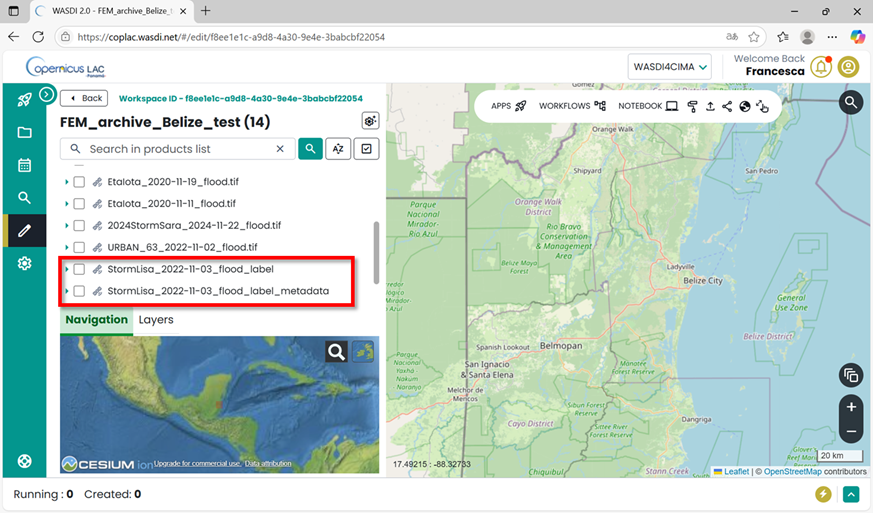
Figure 8. Output of the Flood Map Labeling app.
To display the flood extent map:
Toggle to the selected layer ([input_flood_map_name]_label).
Expand the selection until you reach the “band” section.
Click the lightbulb icon to visualize the map.
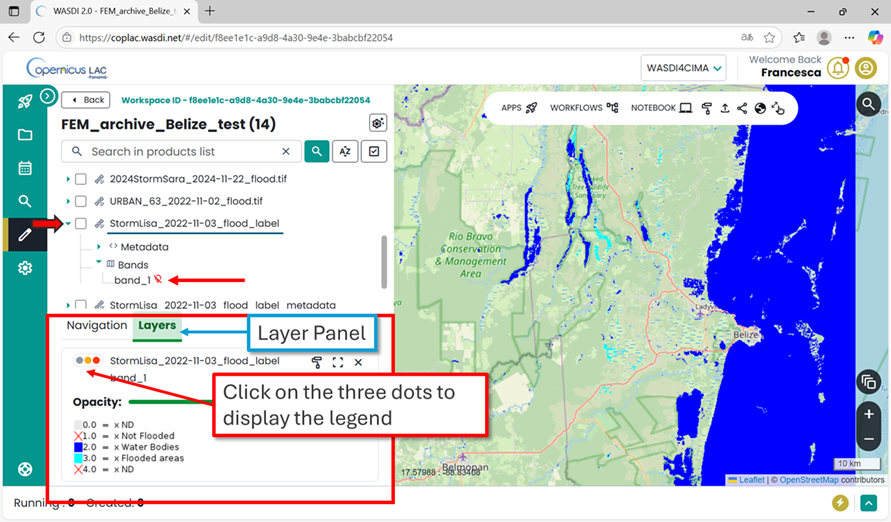
Figure 9. Visualization of flood extent map
To visualize the newly added metadata:
Select the corresponding [input_flood_map_name]_label_metadata file in the list.
Expand the selection and click on “metadata”.
A dialog message will appear, notifying you that the metadata are being generated.
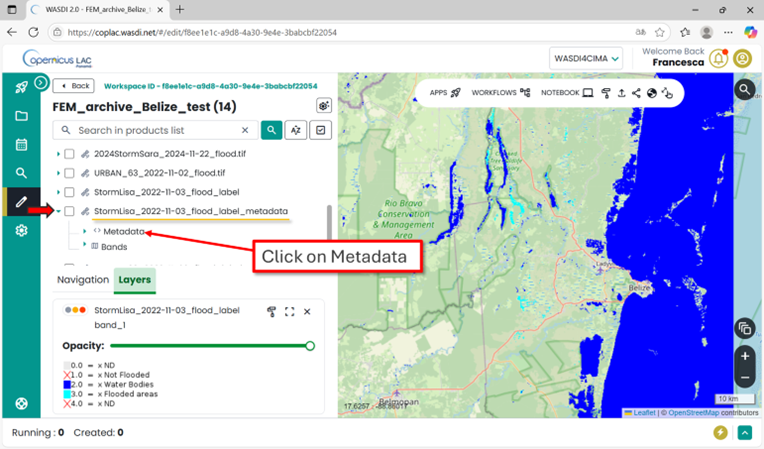
Figure 10. Access the metadata
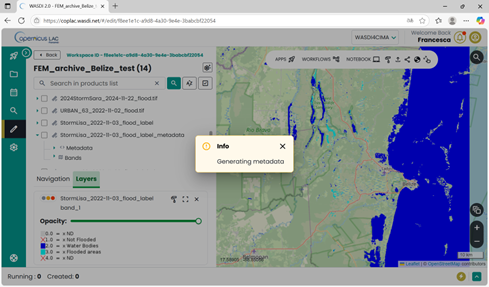
Figure 11. Generating metadata
Wait a few seconds, then open the metadata section and double-click on “Image info”. The metadata will then be displayed in the interface.
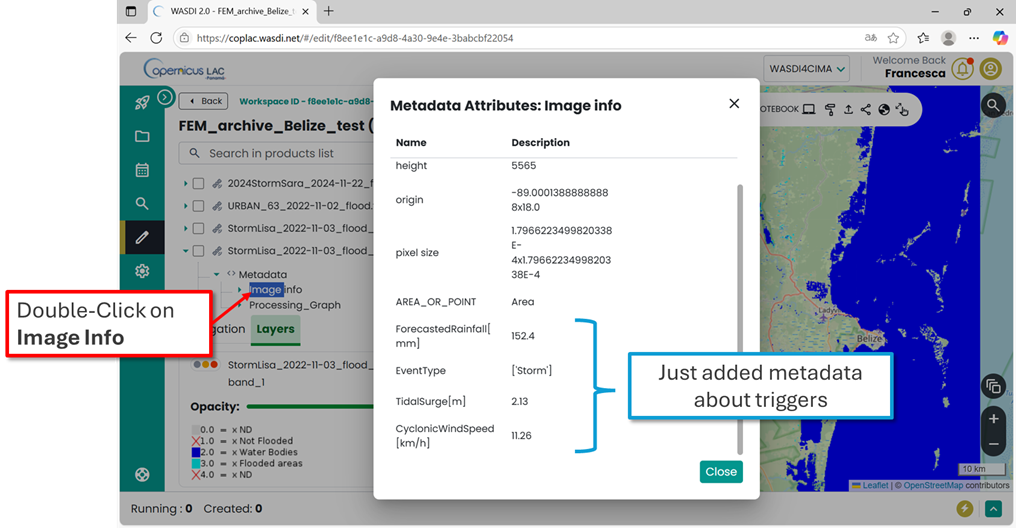
Figure 12. Metadata displayed in the Specialized PE.
Map Fetching By Metadata
To retrieve from the archive the flood maps that were generated for specific flood events with specific weather conditions, users can use the Map Fetching by Metadata available in the marketplace.
Open the application, in the main menu, in the bottom “Run App in” section select the workspace where the labelled flood extent maps are stored.
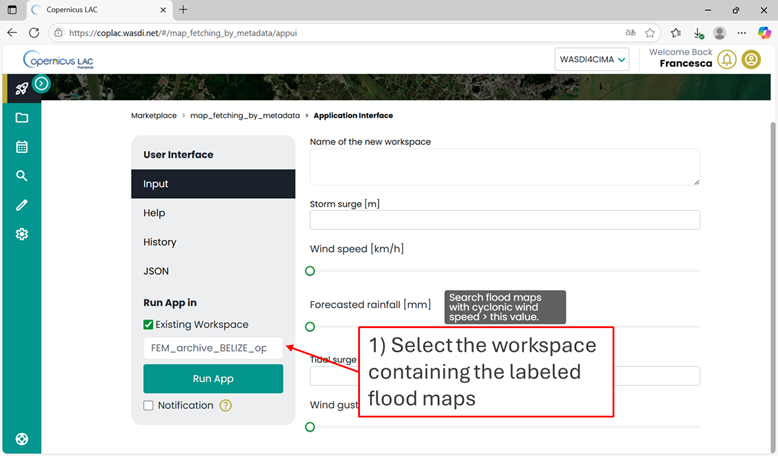
Figure 13. Map Fetching By Metadata – Run the app in the workspace where the label data are stored
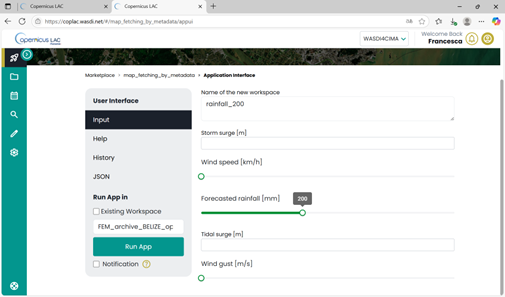
Figure 14. Map Fetching By Metadata – Set the input parameters
Set the filters on the parameters for your query. Keep in mind that:
The search will retrieve flood maps with trigger values greater than or equal to the value you set.
The search is currently designed to retrieve all maps that satisfy at least one of the search parameters.
Once all parameters are set, click the “Run App” button in the Main Menu. The platform will automatically redirect you to the workspace you selected (the archive).
After few seconds in the list of your workspace, in the workspace menu, you will find the new one, for this example “rainfall_200”
Open “rainfall_200” and you will see the list of flood extent maps satisfying your query. In this example, you will retrieve the flood extent maps with associated forecasted rainfall > 200 mm.
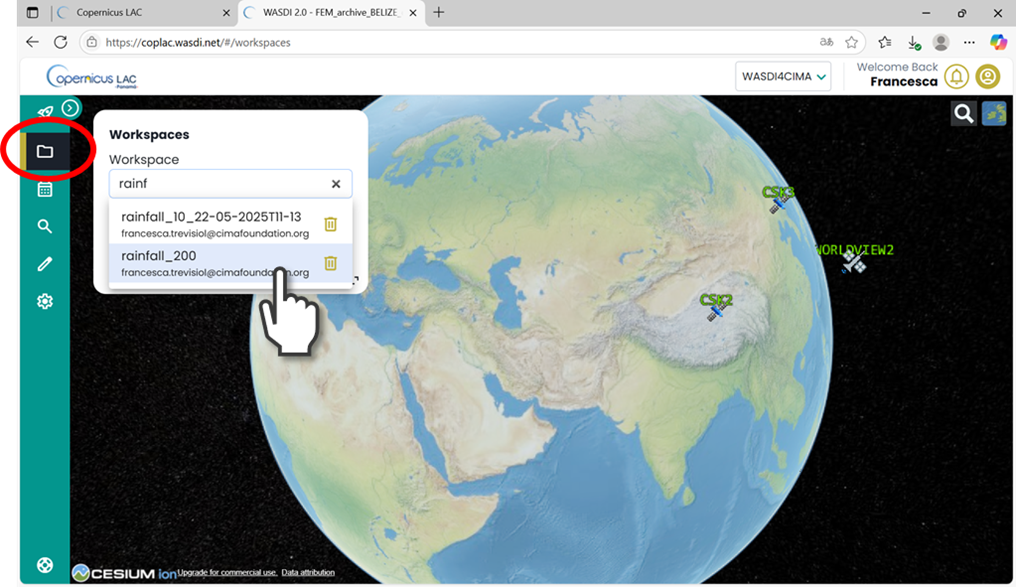
Figure 15. Access the new workspace just created
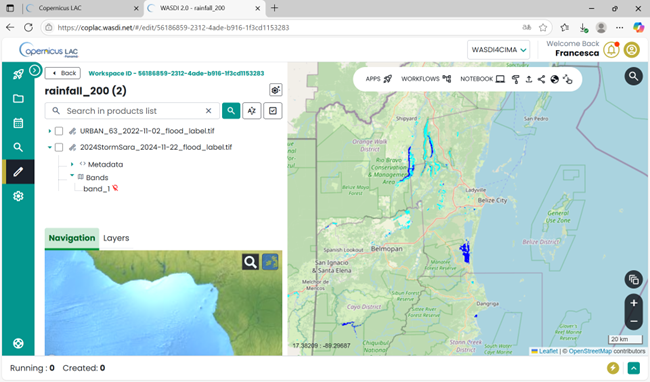
Figure 16. New workspace with the maps that satisfied the input parameters of the query
Output, data visualization and download
The service will produce as output the following GeoTIFF:
“[CODE]_[DATE]_flood.tiff”: Flood extent map from SAR Sentinel-1 data acquired on [DATE] (legend 1);
“[CODE]_[DATE]_s2-flood.tiff”: Flood extent map from optical Sentinel-2 data acquired on [DATE] (legend 1);
“[CODE]_[StartDate]_[EndDate]_sar_flood_sum_days_[N].tif” Cumulative maximum extent computed from the available SAR-derived flood extent maps in the N days interval defined by StartDate and EndDate (legend 1).
“[CODE]_[StartDate]_[EndDate]_flood_sum_days_[N].tif” Cumulative maximum extent computed from the available SAR and optical derived flood extent maps in the N days interval defined by dateStart and dateEnd (legend 1).
“[CODE]_dateStart_dateEnd_flood_frisk_[N].tif” Comparative map that compares optical and SAR derived flood extent maps in the interval (legend 2)
Legend 1:
0 - No Data
1 - No Flood
2 - Permanent Water
3 - Flooded Areas
Legend 2:
0 - No Data
1 - No Flood
2 - One Map flood, the other one not flood
3 - One Map flood, the other one no data
4 - Both Maps flood
5 - Permanent Water
You can either visualize the layers directly within the Specialized PE workspace or download them to your local device for further processing.
How to display data in your workspace in the Specialized PE?
Find your layer of interest in your workspace, expand the selection and toggle on the layer of interest and click on the lightbulb icon.
The selected layer will be displayed on the map, and the product should appear in the list of products in the Layer panel (Figure 17).
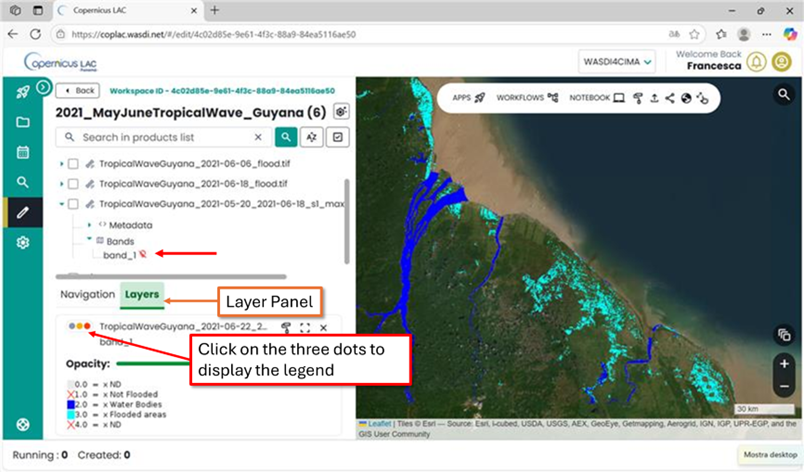
Figure 17.CopernicusLAC Specialized PE map visualization
How to download data from your workspace in the Specialized PE?
Access your CopernicusLAC Specialized PE workspace
Find your layer of interest in your workspace, and select it (Figure 18 - 1). The download option will appear on top the layer list (Figure 18 - 2).
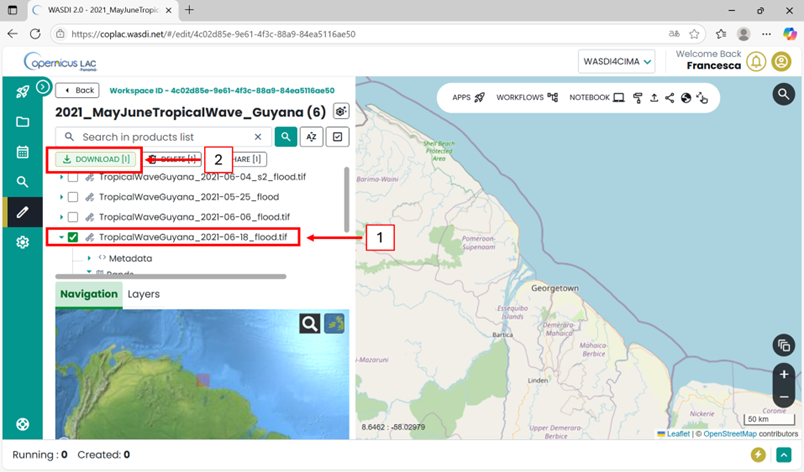
Figure 18. CopernicusLAC SpecializedPE data download