Flood Frequency Mapping Details
The Flood Frequency Mapping (FFM) service exploits multitemporal flood extent mapping to generate a flood frequency map that illustrates flood occurrence patterns. The service relies on flood maps derived from both optical and SAR data that are systematically analysed over the entire Sentinel-2 (L2A) and Sentinel-1 (GRD) archive from 2015 to 2024, with regular updates. The service operates independently of user triggers, generating updated flood extent maps using Sentinel-1 and Sentinel-2 data and an automated change detection algorithm. Over time, the full stack of these flood extent maps is analysed to produce the comprehensive flood frequency map that shows the recurrence of flooding across the AOI.
The FFM service generates a flood frequency map, reporting the proportion of time in which a given pixel has been inundated.
The EO data from the Sentinel-2 L2A and Sentinel-1 GRD collections is ingested and calibrated in automated fashion for the full 2015-2024 catalogue. For each Sentinel-2 and Sentinel-1 data, the FFM service automatically produces water delineation maps using the CIMA’s autowade_s2 and autowade_s1 algorithms. The service takes the full stack of Sentinel-1- and Sentinel-2-derived flood maps to compute the flood frequency, where each pixel has a value between 0 and 100%, indicating how many times it was flooded out of the total number it was observed (see figure below as example).
The FFM service has an initial execution to compute the flood frequency of the full 2015-2024 archive. Afterwards, the flood frequency map is updated every six months, incorporating all new Sentinel-1 and Sentinel-2 acquisitions in the analysis.
This service is provided by CIMA Research Foundation and WASDI SARL.
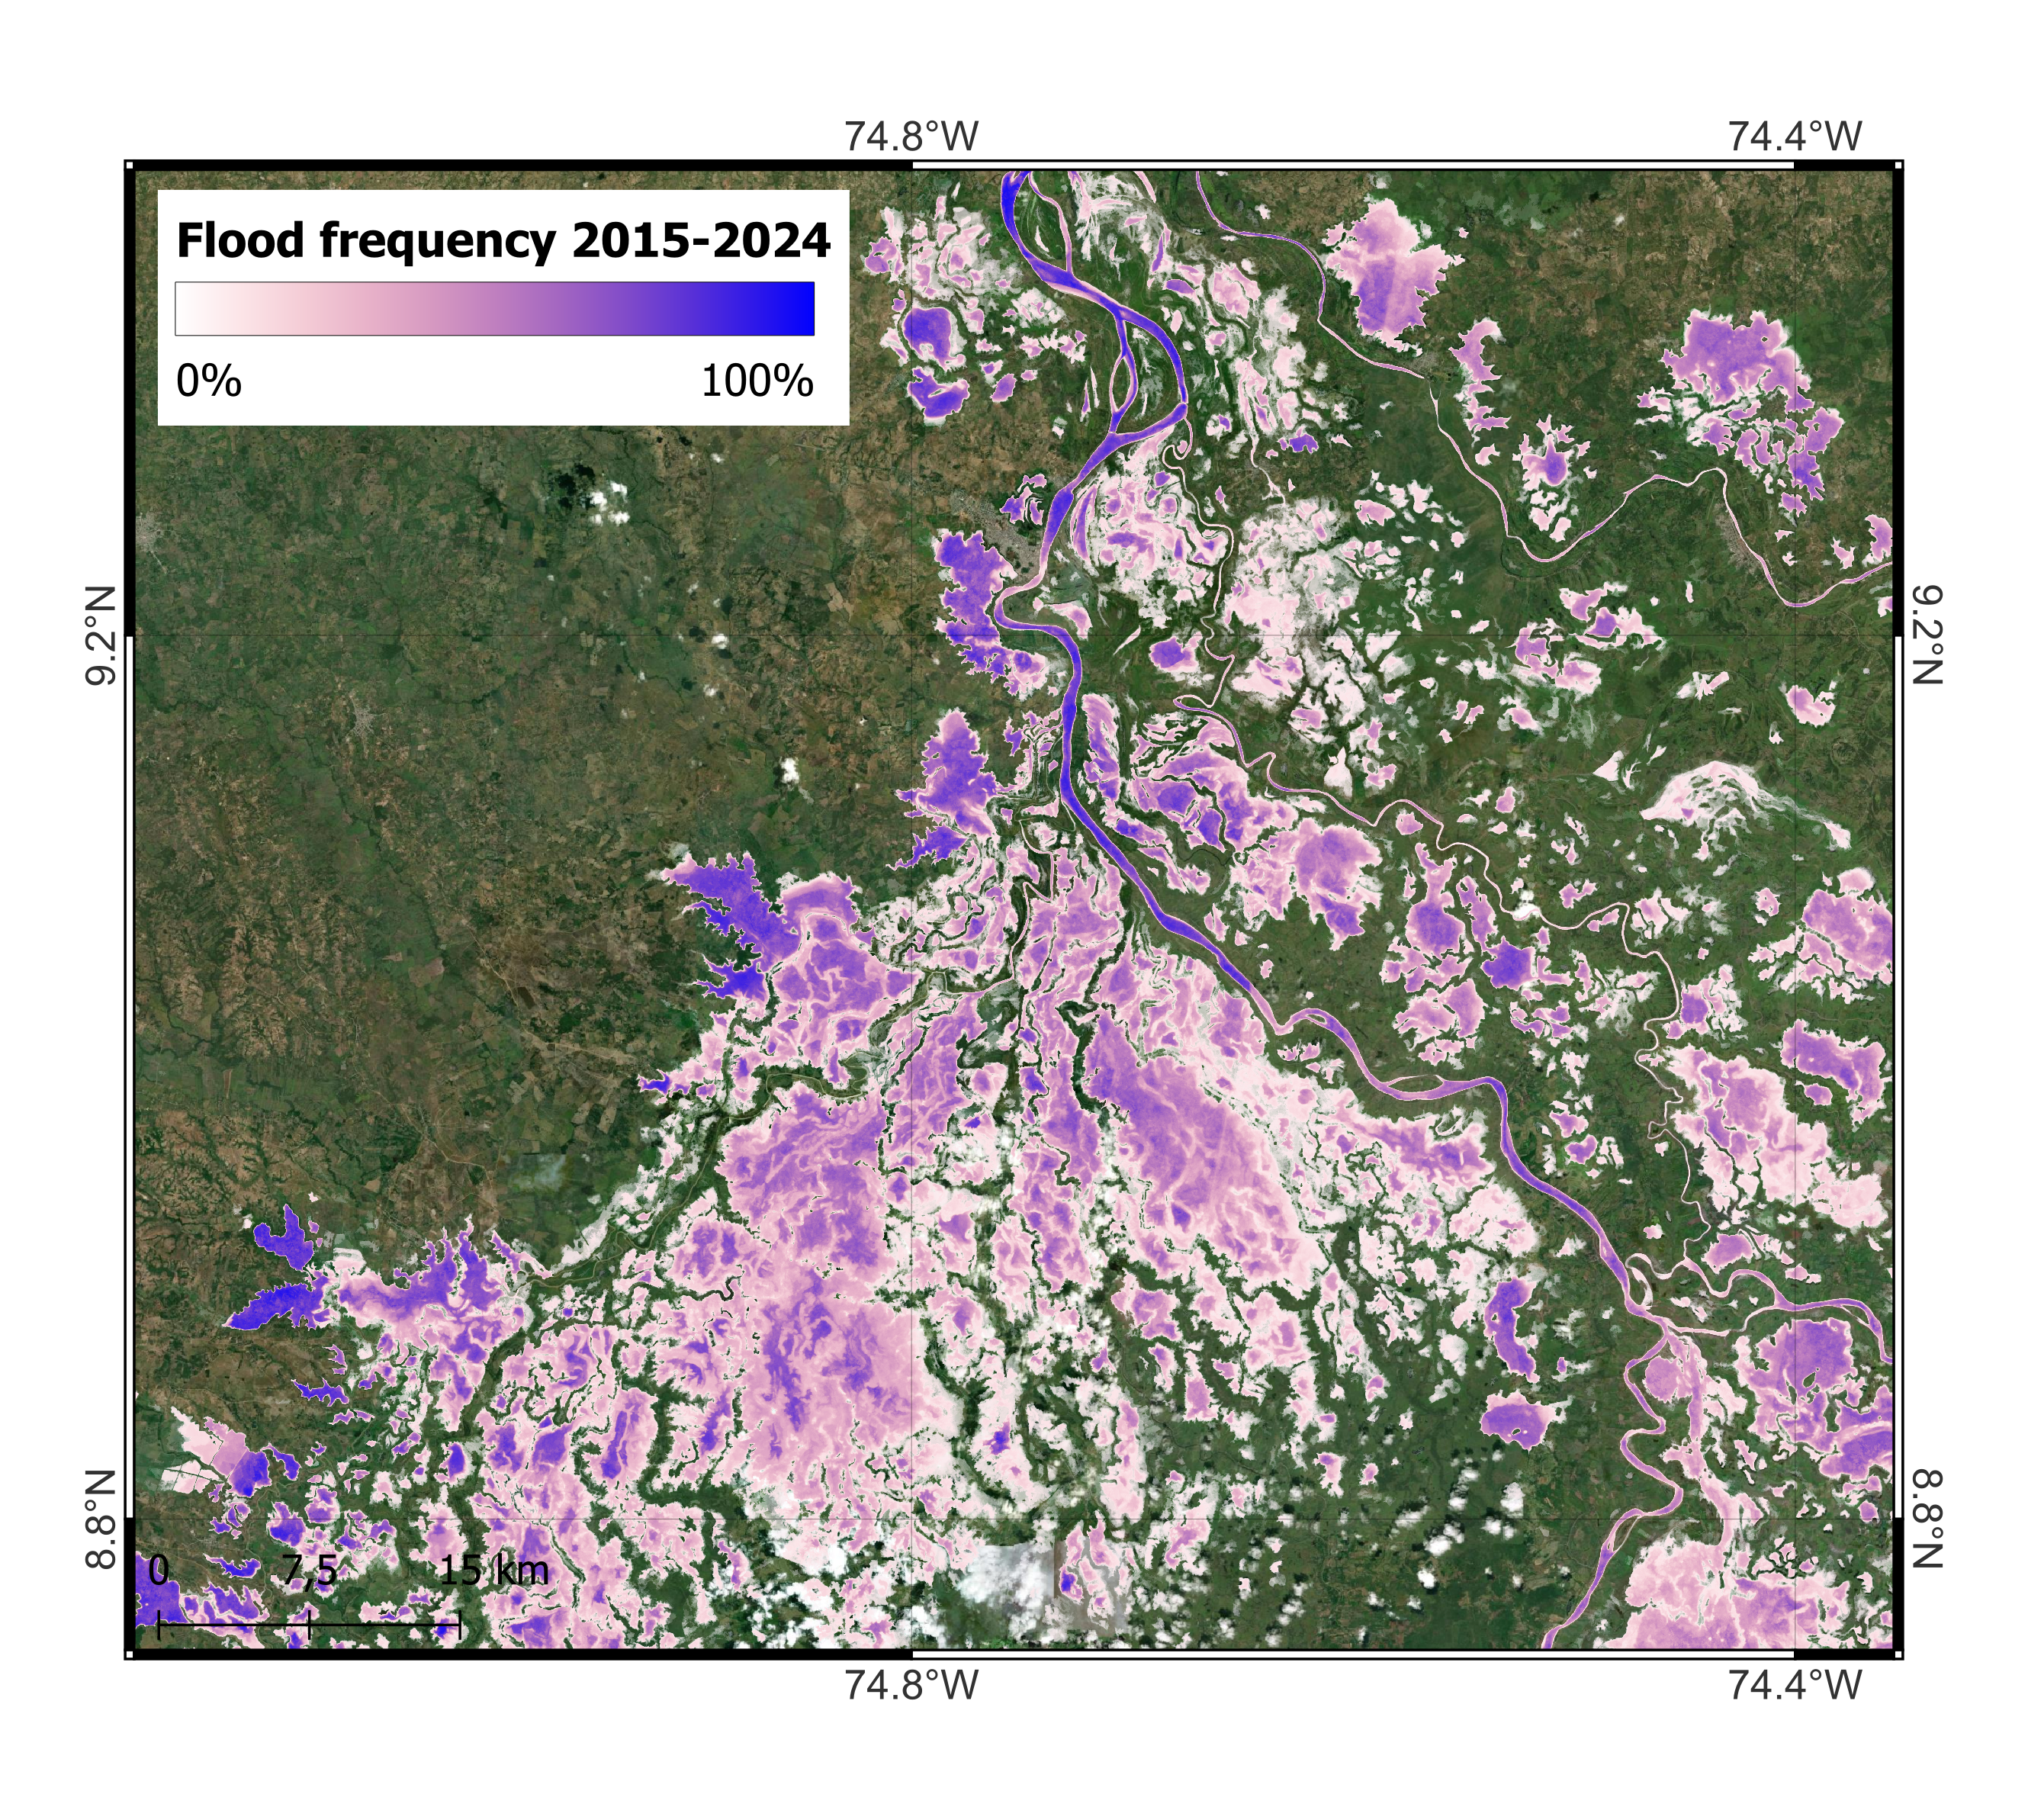
Example of flood frequency product obtained for the period 2015-2024 over Mojana (Colombia). Credits: CIMA Foundation
Workflow
The schema in this section describes the high-level workflow of the FFM service.
The workflow requires as only input an Area of Interest (AOI) (e.g. a portion of the Colombian territory) where to perform the analysis.
After that, the service launches the automatic flood mapping on the full catalogue of images available from Sentinel-1 and Sentinel-2 missions, supported by ancillary data such as the CopDEM [1] and the WorldCover by ESA [2]. The flood maps derived from Sentinel-1 and Sentinel-2 are then ingested in the respective flood frequency computation tools. The flood frequency maps derived from the Sentinel-1 and Sentinel-2 processing chains separately are finally merged into a single output product.
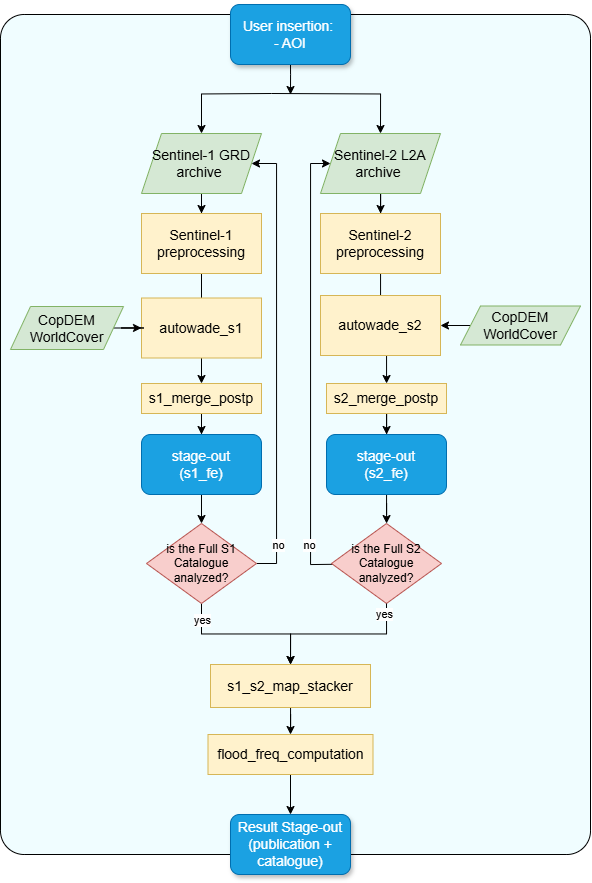
Workflow of the FFM service
Below are given details of each step of the chain described in the FFM workflow.
Sentinel-1 GRD preprocessing
This module includes a standard preprocessing workflow to obtain Sentinel-1 calibrated, corrected and projected sigma nought intensity images in dBs using as input Sentinel-1 GRD products. The preprocessing module includes the pairing of pre and post images per orbit to be ingested by the autowade_s1 algorithm.
Sentinel-2 L2A preprocessing
This part of the chain is dedicated to the Sentinel-2 MSI L2A data preparation and spectral index computation. Preprocessing includes cloud and shadow masking by means of the S2 Scene CLassification (SCL) map, followed by the Modified Normalize Difference Water Index (MNDWI) generation [3]. MNDWI, delivered at 20 m resolution, is extracted and given as input for following steps of the workflow.
autowade_s1
The AUTOWADE (AUTOmatic Water Areas Detector) algorithm, developed by CIMA, is tailored to process Sentinel-1 data (autowade_s1) [4]. The methodology aims to produce maps delineating both permanent and floodwater extent using a change detection approach, between pre and post event image acquired in the same orbit geometry. First, certain areas of the pre-processed Sentinel-1 GRD image are excluded from the analysis, including steep regions (based on Cop-DEM slope data) and urban areas (based on WorldCover). Permanent water bodies are identified using a Buffer-from-Edge approach. In this process, an unsupervised clustering algorithm is applied to the co-polarized VV image to segment groups of similar pixels. The class with the lowest median is assumed to represent water pixels. The derived Continuous Dynamic Water Area (CDWA) is then compared with the reference permanent water layer from WorldCover. The intersection between both datasets undergoes edge detection, followed by a buffering operation to obtain a bimodal distribution of water and non-water pixels. Once this distribution is achieved, an automatic thresholding method is applied. To refine the classification of permanent water, a region-growing approach is employed to ensure all neighbouring water pixels are included. The same strategy is used to classify floodwater, but in this case, the method is applied to the difference between post-event acquisitions and the most recent pre-event image from the same orbit geometry.
autowade_s2
The AUTOWADE (AUTOmatic Water Areas Detector) algorithm, developed by CIMA, is tailored to process Sentinel-2 data (autowade_s2) [4]. The methodology aims to produce maps delineating both permanent and floodwater extent. Certain areas of the pre-processed MNDWI data are excluded from the analysis, including steep regions (based on Cop-DEM slope data) and urban areas (from ESA WorldCover). Water detection follows the “Buffer-from-Cluster Approach,” as described by Pulvirenti et al. (2020) [5]. An unsupervised clustering algorithm is applied to the spectral index to group similar pixels within the scene, assuming that the class with the highest median represents water pixels. The resulting Clustering-Derived Water Area (CDWA) undergoes edge detection, followed by a buffer operation to generate a bimodal distribution of water and non-water pixels. Once this distribution is established, an automatic thresholding method is applied. To refine the water classification, a region-growing approach is used to ensure all neighboring water pixels are included. Finally, by intersecting the water delineation map with the reference water layer (derived from ESA WorldCover), permanent water is identified (pixels classified as water in both WorldCover and theSentinel-2-derived map), while flooded water is distinguished (pixels classified as water only in the Sentinel-2-derived map).
s1_merge_postpr
This step processes the output of autowade_s1 to address noise removal, border effects, and other issues that may impact the final result. If the given AOI intersects multiple S1 tiles, the processor mosaics the flood maps from different tiles to generate a single, unified flood map.
s2_merge_postp
This step processes the output of autowade_s2 to address noise removal, border effects, and other issues that may impact the final result. If the given AOI intersects multiple S2 tiles, the processor includes the mosaicking of the flood maps from different tiles to have a single flood map.
s1_s2_map stacker
This module performs coregistration and resampling on the full stack of flood extent maps derived from Sentinel-1 and Sentinel-2 imagery, with the purpose of aligning all input maps to a common spatial grid.
flood_frequency_computation
This processor performs a pixel-based analysis on a stack of flood extent maps to generate flood frequency map. For each pixel, it counts the number of times the corresponding surface was inundated across the input flood maps. This count is then normalized by the total number of maps used in the computation, resulting in a frequency value expressed as a percentage (0–100%) for each pixel.
Input
The FFM service requires in input:
Sentinel imagery
Sentinel-1 GRD data: all available acquisitions acquired over the AOI within the period considered,
Sentinel-2 MSI L2A data: all available acquisitions acquired over the AOI within the considered period, having a cloud coverage lower that 70%;
Ancillary data: to be used in the AUTOWADEs algorithms
Parameters
The FFM service requires a specified number of mandatory parameters. The table below describes these parameters. These are not defined by the user via the GUI but can be defined by the service operator within a configuration file before the triggering of the FFM service workflow.
Parameter |
Description |
Required |
Default |
|---|---|---|---|
Area of interest |
Area of interest to be covered by the service in WKT (e.g. extent of a district in Colombia) |
YES |
|
Max cloud coverage of Sentinel-2 images |
The maximum percentage of cloud coverage in the valid pre-event images to be used |
NO |
70 |
Buffer size |
Size of the buffer to be implemented in the buffer-from-edge approach of autowade_s1, autowade_s2, express in number of pixels. |
NO |
10 |
MIN CLUST NUM |
The minimum number of clusters to initialize the autowade_s1 algorithm |
NO |
6 |
Output
Flood frequency map
Definition: flood frequency map, with each pixel showing how many times it was flooded out of the total number of times it was observed as percentage. Valid range [0-100%].
Data type and format: UInt8, GeoTIFF.
Spatial resolution: 20m.
Frequency of observations: 5-12 days.
Update frequency of the product: six months.
Spatial coverage: depending on the availability of resources, the area of interest will be selected with the final user. The system is potentially extendible to the whole LAC region.
Constraints: availability of good quality Sentinel-1 and Sentinel-2 acquisitions; zonal or hydrological limitation (e.g. flash floods)